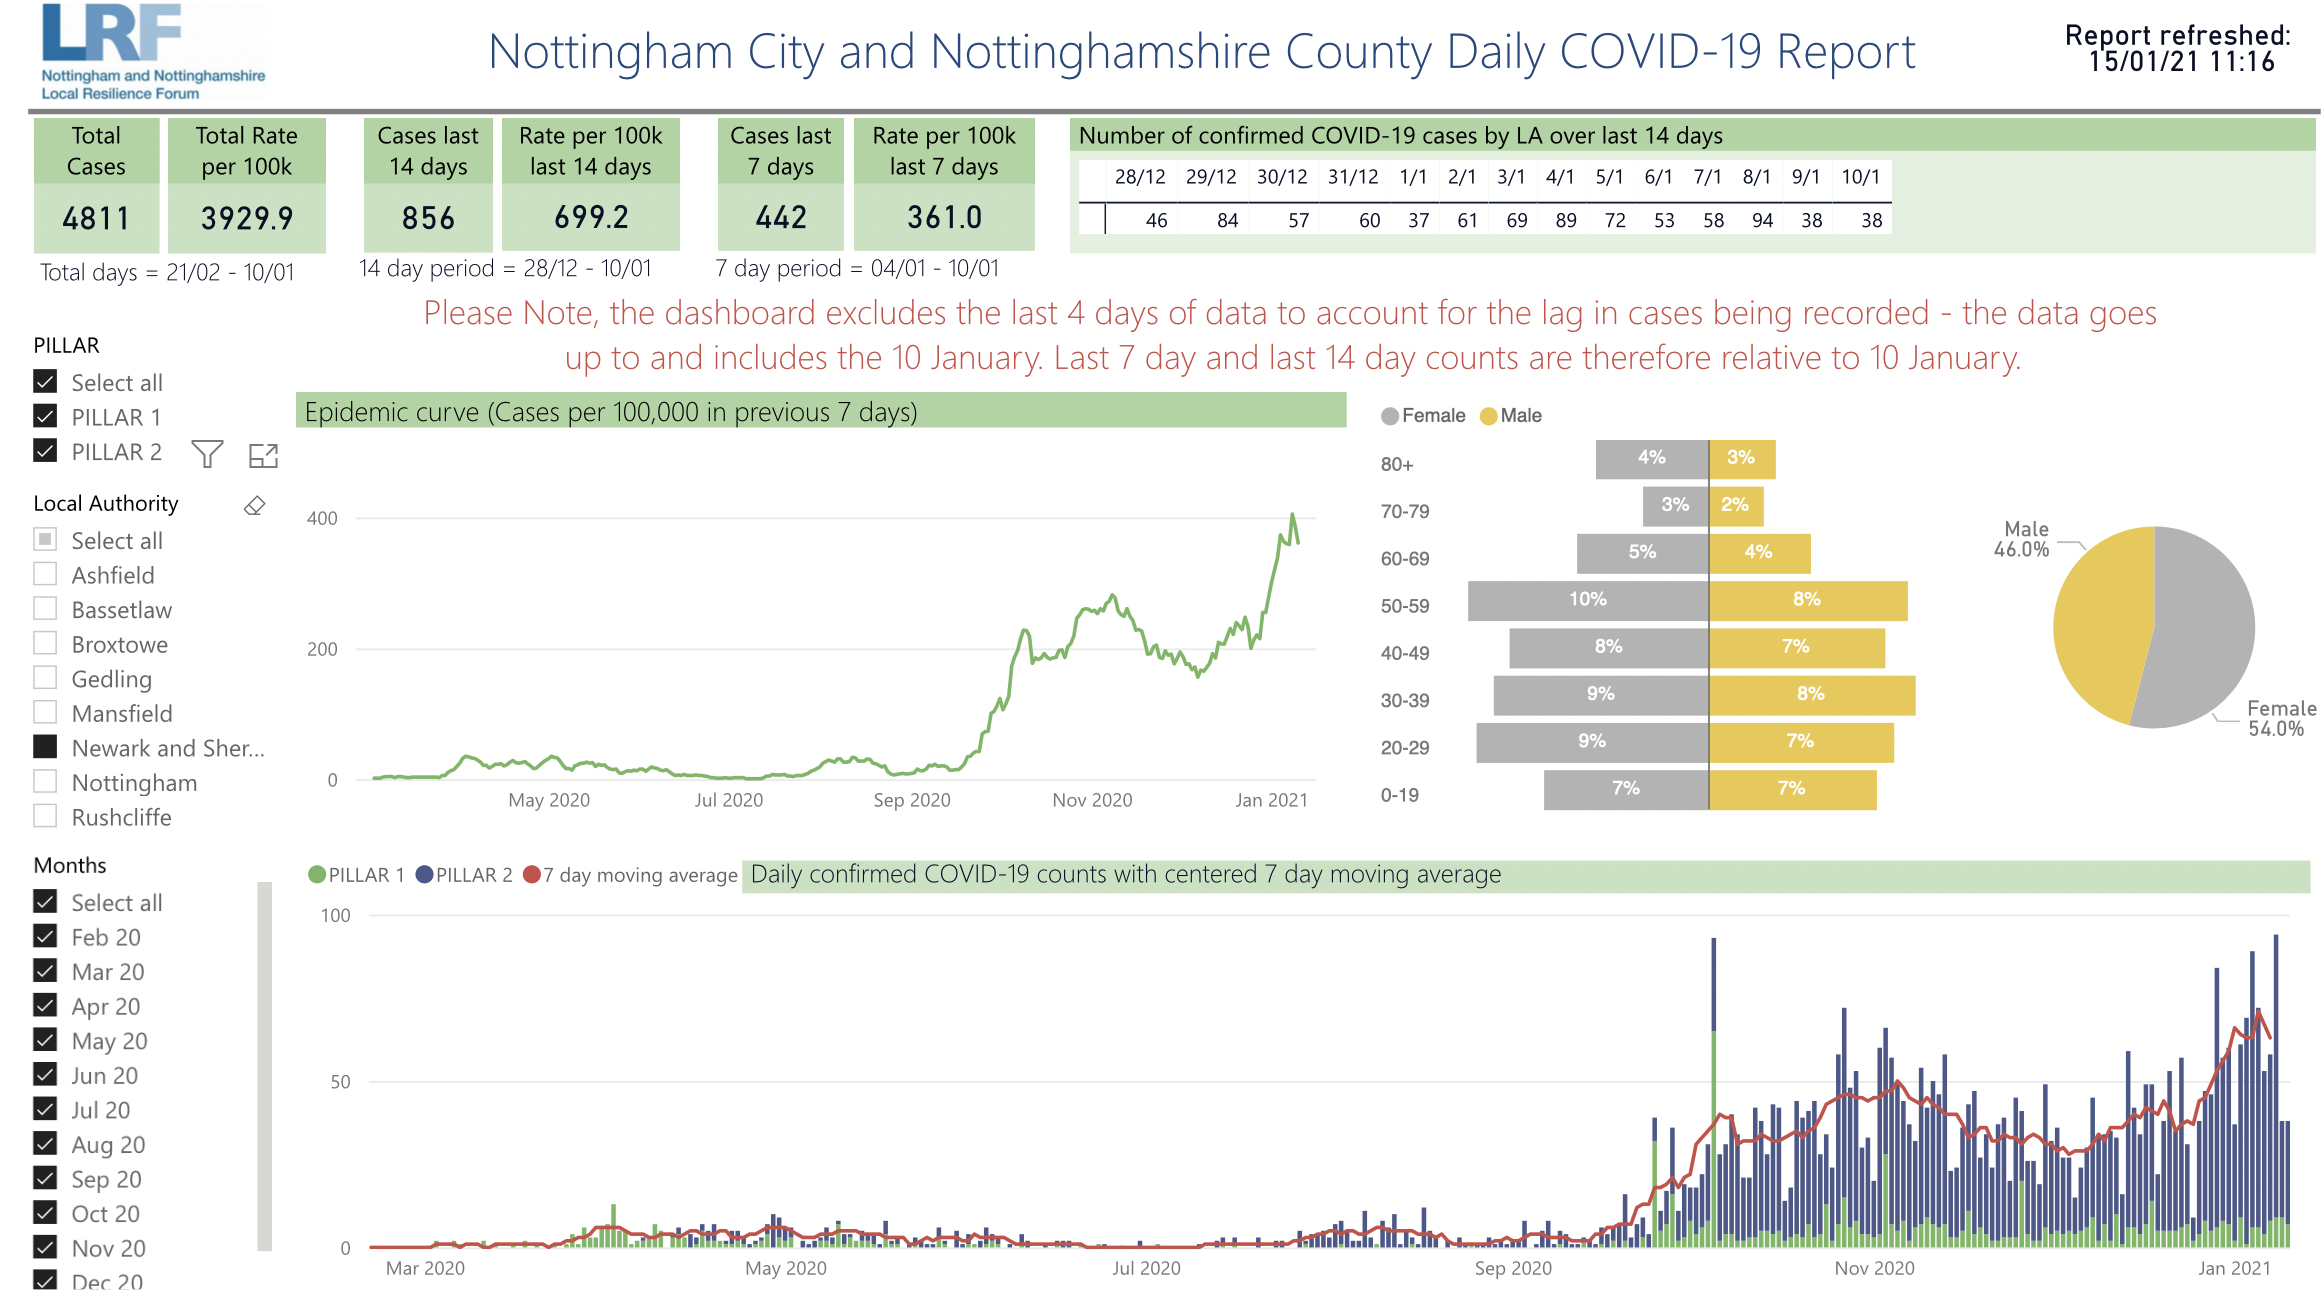
The reports summarise information which is used to monitor cases of the Covid-19 pandemic in Nottingham.
In the images see the left list of local authority areas – the area with the box filled is the one you’re viewing.


For example: Data latest to 10th January 2021.
Cases per 100,000 over seven days:
Total for Nottinghamshire 435 ( 442 )
Nottingham 481 (520)
Newark 361 (404)
Mansfield 559 (561)
Gedling 441 (536)
Broxtowe 354 (389)
Bassetlaw 280 (311)
Ashfield 569 (616)
Rushcliffe 350 (379)
You can then read other data for that area – updated daily.